If you’ve read the first part of this article, you now know how to estimate the size of the chunks that constitute your backlog, and what you’re looking for in this part is how to translate it into what your stakeholders actually crave for : dates.

The first missing part between your estimations and dates is an essential component of a Scrum team’s metrics : the Velocity.
The Velocity is simply the average number of points (really, read the first part of this article if you don’t know what I’m talking about…) that you have done in your last sprints. You just sum the number of points of all the stories that have been completed during the sprint, and tadaa, you have your velocity for this sprint.
(Ok, for that, you’ll also need to align on what “done” means, but that’ll be another story, folks)
So once you have measured on a few sprints how many points the team can complete, then you begin to have an idea about your average velocity. The aim being to leverage 2 other metrics to stabilize it :
- the commitment = the number of points the team includes in a sprint
- the predictability = the % of number of points done versus the number of points committed
So the velocity will tell you approximately how many points the team can finish per iteration, and the predictability will tell you how much your velocity is precise and stable.
Now let’s say you have sliced your backlog in several pieces of the right size, that these pieces are ordered by priority (that’s some matter for again another article), and that all these pieces have been estimated relatively to one another. You also have a more or less precise idea about the velocity of the team.
The way to translate relative estimations into time spent on these pieces is based on an empirical approach. At first, when you start a project with a new team, you have a very rough idea of the velocity of the team, that will become more precise with time, testing and learning. The velocity will always vary, and globally the more experience you have with a team, the more stable the velocity should become.
That’s what I’ll call here the “cone of uncertainty”, and this cone will narrow down the more we advance in the project.
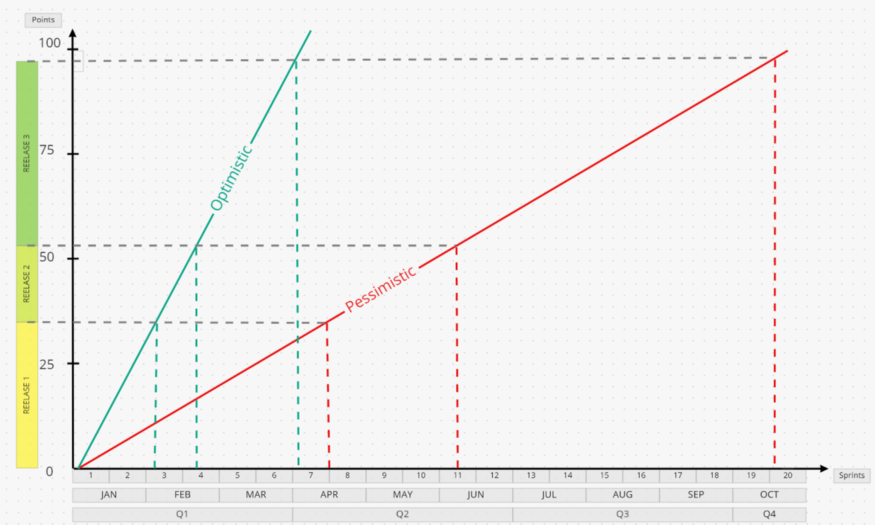
In the example above, you find several elements we’ve cited :
- on the left, you find your backlog, prioritized, sized, and distributed into 3 releases
- on the bottom, you have your time scale, by sprint of 2 weeks.
- On the graph, you have two different lines :
- an optimistic projection of the team’s velocity
- a pessimistic projection of the team’s velocity
The gap is voluntarily huge between these two lines, for several possible reasons :
- you discover a new team, you have actually no clue what your actual velocity is, and you won’t know before a few sprints,
- you want to raise awareness among your stakeholders that you live in a very uncertain world and that you need to adopt an empirical approach
Now there are actually 2 ways of using this kind of graph :
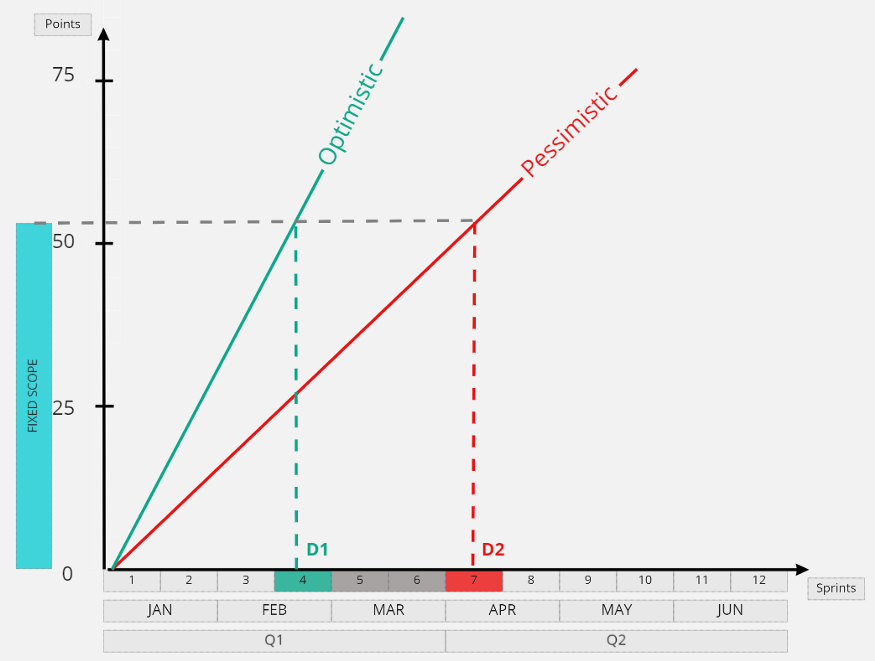
- Fixed scope : you can’t actually remove anything from this part of the backlog, so you do the projection on the optimistic and pessimistic lines, which will give you ranges of dates for delivery. You can then tell your stakeholders that you will deliver this scope between dates D1 and D2, reality being most certainly between these 2 dates.
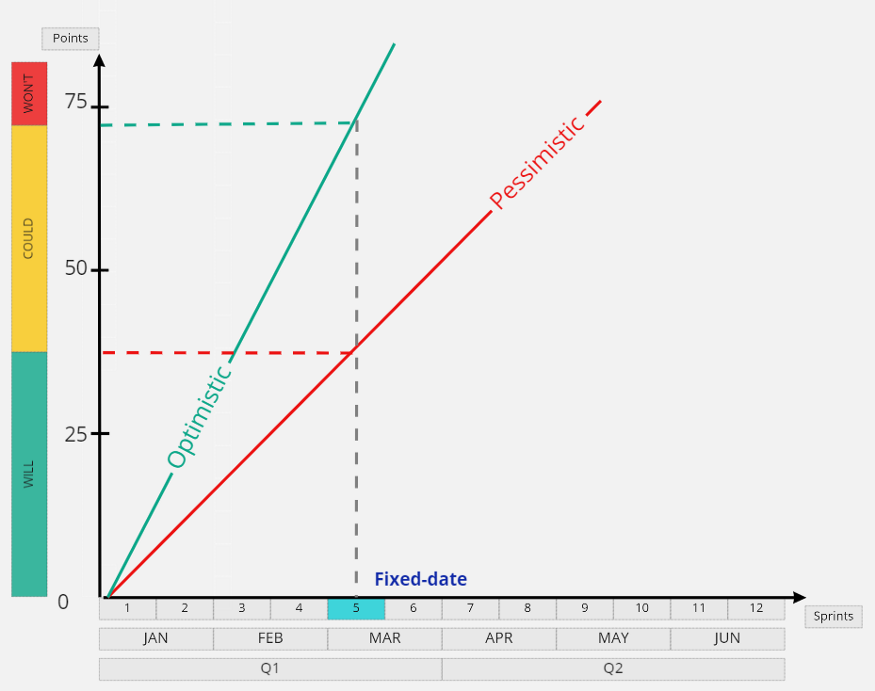
- Fixed date : the scope is adaptable, you can actually remove or challenge things in the current state of your backlog, but the dates are fixed, we need a result by a fixed date. Then you’ll do the projection on the optimistic and pessimistic line, which will give you an estimation of the scope that could be delivered by this date. You can then show clearly what we are pretty sure to deliver (WILL), what we could deliver if we are realistic (COULD), and we are sure not to deliver (WON’T) by this date.
The more you advance on your project, the more these zones of uncertainty will be narrowed down. So it requires that you keep your stakeholders updated very regularly about where you are in your process of discovering what is on the road ahead.
You can also see clearly here, and show your stakeholders, that the model with a fixed date AND a fixed scope is not compatible with this approach.
This approach allows you to communicate what your stakeholders expect, but also to raise their awareness on how to plan in an agile way inside an uncertain context.
If you liked this article, don’t hesitate to follow me on LinkedIn. I’m always happy to discuss the topics I’m writing on and to receive feedbacks. Thank you !
Ping :Scrum : Pourquoi est-ce si dur de définir un bon sprint goal ? - Pierre Merlin
Ping :Agile Myth #2 : L’agilité c’est l’anarchie ! - Pierre Merlin